Know the local care market before you buy, build or bid
Demand, supply, quality, fees, owners and council plans for one council area, in a single report you can read tonight. Built from CQC, ONS and council data, explained in plain English.
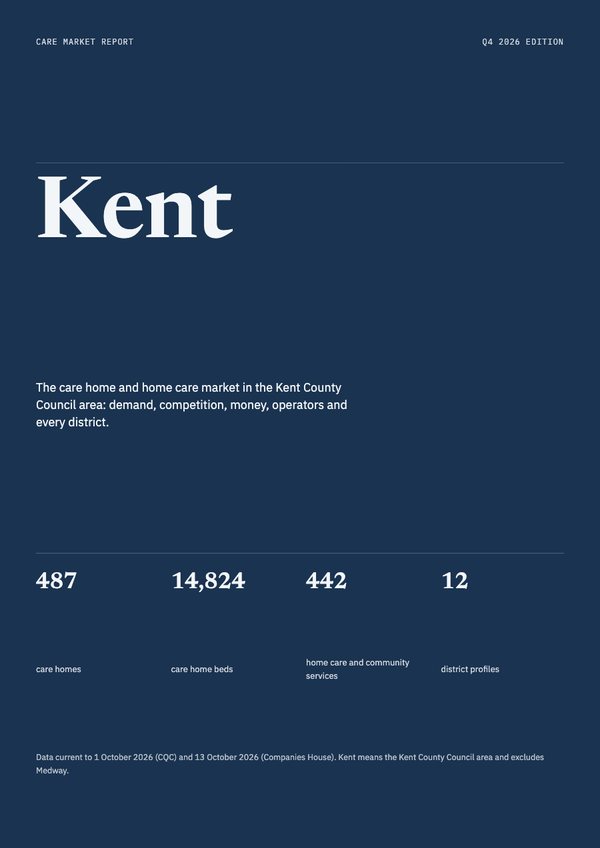
Kent
Written for the decision in front of you
"Is this area short of beds, and what will the council pay?"
Supply by district, fee rates, ratings and recent sales activity.
"Where are agencies thin and which districts are crowded?"
Services per head by district, new registrations and the hourly rate.
"Does the local market support this valuation?"
Demand to 2035, funding mix, operator finances and lending activity.
"What does the council actually want to commission?"
Market Position Statement priorities and the opportunity scorecard.
A real report, not a dashboard
Read it on the web or download the PDF. Charts, tables and plain English findings, with every home in the area listed at the back.
- About 48 pages for one council
- Web report and PDF, with live data coming soon
- Source and date under every figure
About 48 pages on one council, every figure sourced
The same structure for every area, so you can compare councils side by side.
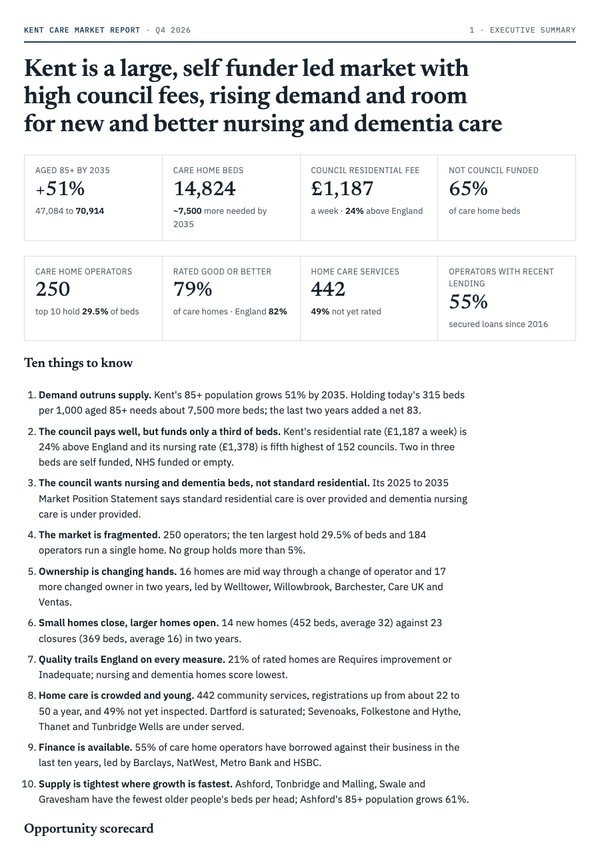
- Demand85+ growth and beds needed by 2035
- SupplyHomes, beds, nursing and dementia
- QualityCQC ratings by key question
- CompetitionOperators, groups and market share
- Change and ownershipOpenings, closures and sales
- Home careAgencies, gaps and new entrants
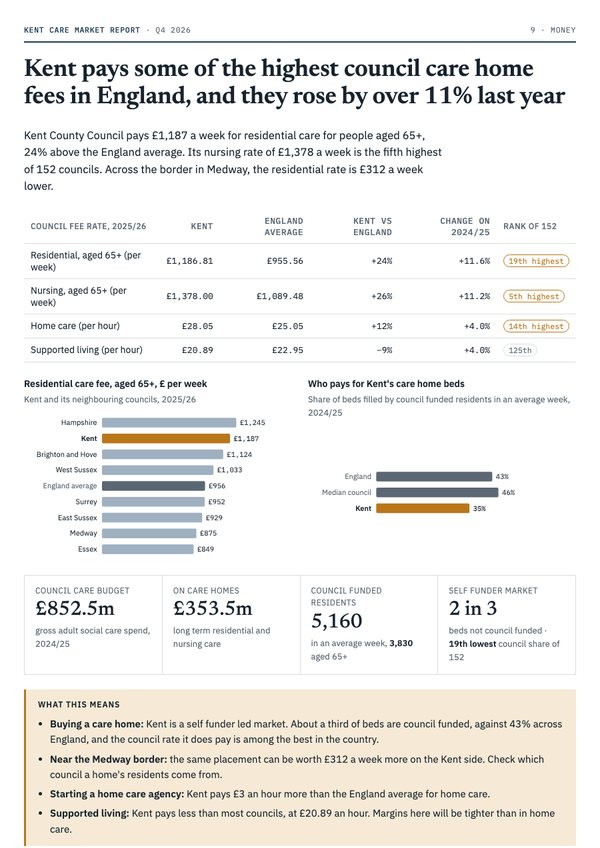
- MoneyCouncil fees and who pays
- Operator financesLending and Companies House flags
- What the council wantsCommissioning priorities to 2035
- Every districtProfiles with every home of 20+ beds
Four districts have fewer than 250 older people's beds per 1,000 aged 85+
Older people's care home beds per 1,000 aged 85+, by district, 2026
Source: CQC active locations, 1 Oct 2026; ONS 2022 based projections.
Council fees for the same care differ by £873 a week
Each line is one council's weekly rate for residential care for people aged 65+. Location changes everything, which is why we report council by council.
Source: Market Sustainability and Improvement Fund returns, 2025/26. 152 councils.
From search to report in a few minutes
- Pick your council
Search by council, town or postcode. We match towns and postcodes to the right council area.
- Read the free preview
Headline numbers, a map, the first findings and one full sample chapter, before you pay anything.
- Buy and read straight away
Pay by card and open the web report and PDF at once. Your reports stay in your account.
One area, one clear price
Every district, every care home, council fees and council plans for one area, from £295.
Council report
Buying a home, starting an agency, or planning a service in one area.
- All 14 chapters and every district profile
- Web report and PDF
- One user
Report plus live data
For people who want to keep watching the area after they buy.
- Everything in the report
- 3 months of live data for the council when it launches
- Founder pricing if you then subscribe
Adviser licence
Brokers, lenders and consultants using it with clients.
- Report plus live data
- Use charts in client work with credit
- Unlimited users in your firm
Latest from the data
Nursing home fees: which councils pay the most in 2025/26?
Council nursing home fees for a week of care for an older person run from £712.63 in Nottingham to £1,809.97 in City of London. Kent pays the 5th highest rate of 152 councils, and £252.11 a week more than Medway next door.
13 Oct 2026 · 11 min readFees and fundingWhich councils pay the most for residential care in 2025/26?
Weekly rates run from £688 in Salford to £1,560 in Hounslow. We ranked all 152 councils.
9 Oct 2026 · 6 min readHome careHome care hourly rates by council: who pays the most?
Councils paid a median £24.05 an hour for home care in 2025/26, from £31.82 in Hertfordshire to £18.45 in Harrow. London pays least. Kent pays £28.05, £6.13 an hour more than Medway.
8 Oct 2026 · 12 min readBefore you buy
Where does the data come from?
Official sources only: CQC registrations and ratings, ONS population projections, council fee returns (MSIF), adult social care finance returns, council Market Position Statements and Companies House. Every chart names its source and date.
How up to date is it?
Each report is rebuilt every quarter from the latest CQC files. The edition and data date are on the cover, and the page shows when the next update is due.
Is Medway included in the Kent report?
No. Reports follow council boundaries, so Kent means the Kent County Council area. Medway has its own report.
Can I use the charts with my clients?
Yes with the Adviser licence, with a credit line. The Council report and Report plus live data licences are for use inside your own business.
What if a new edition comes out just after I buy?
If your area is updated within 90 days of purchase, you get the new edition free.
Start with the free preview for your area
No account needed to read it.
Live data for your area, coming soon
Follow every care home and agency in your council area as it changes: new homes, closures, changes of owner, new ratings and company filings, with an email when something you follow changes.
Founder pricing: the first 50 subscribers keep their launch price for as long as they stay subscribed.